


 移动平均通道
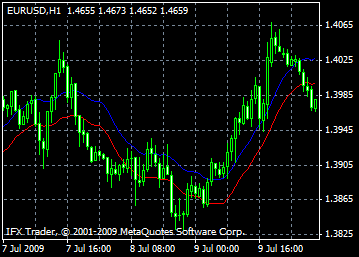
包络线是一种技术指标,通常由价格水平范围的上下两条移动平均线形成。上下边界与价格水平之间的距离有市场波动性决定:当时的波动性越高,距离越大。因此,包络线用于刻画价格大多数时间在其范围内波动的通道。
当价格达到上边界,发出卖出的信号,当达到下边界,发出买入的信号。
包络线根据下列规则判断价格的下一步运动:任何波动之后价格总要回到主要趋势。很多交易者相信该指标是著名的布林带的一个变形。然而这两种指标本质上是不同的。价格偏离其通道越远,交易者获利越多,并且越接近价格返回之前水平的时刻。
计算
上边界 = SMA(CLOSE, N)*[1+K/1000]
下边界 = SMA(CLOSE, N)*[1-K/1000]
其中:
SMA - 简单移动平均;
N - 平均周期;
K/1000 - 偏离平均值(以基点为单位)。

The InstaForex Analyst Team
GK InstaFintech © 2007-2024


Watch webinars
Forex webinar or interactive seminar is a modern and easily available way of learning how to trade Forex online. It is suitable for both novice and savvy investors
Watch webinars
Download InstaForex training course for beginners
Have you just started learning things about Forex? Don't miss our offer! Open a trading account and get the opportunity to download a ready-made training course created by InstaForex professional FX strategists
Download training course
Learn forex trading with tutor
The main training course includes 3 free lessons where our forex expert will tell you how to make accurate trading decisions and help you hone your practice skills
Learn more
InstaForex workshops
Register for workshops on topics which you are most interested in. They are available in online and offline formats. Our professional tutors will organize a thorough discussion of the chosen topics and will explain the most difficult things in a causal language
Learn more

