EUR/USD 5M
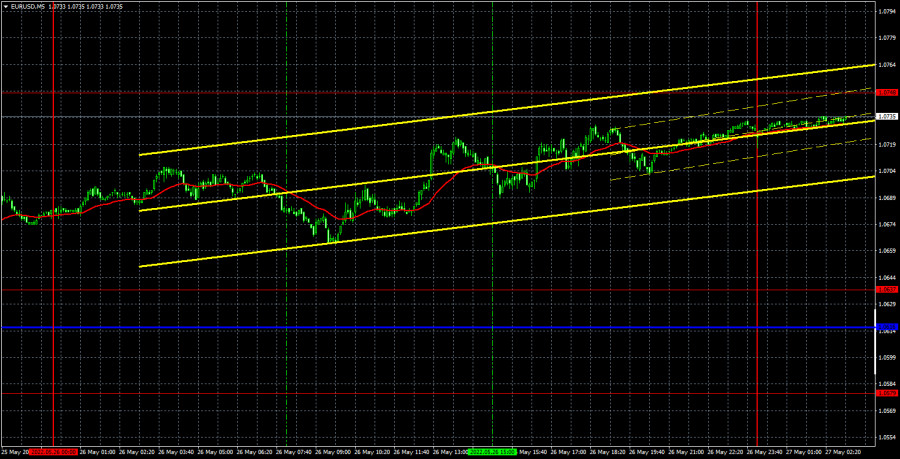
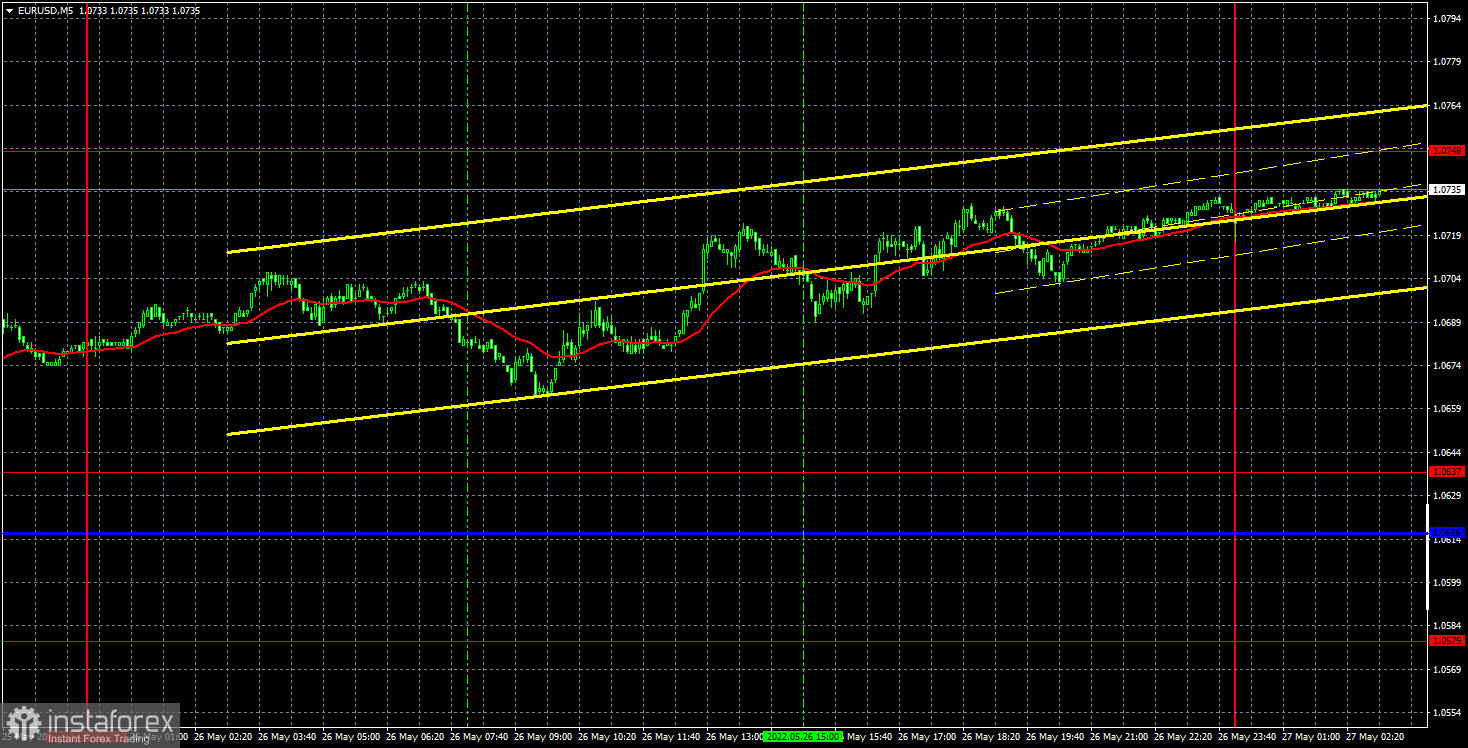
Yesterday, the EUR/USD pair tried to resume its upward movement. So far, we can't say that it succeeded, since the last local high on the hourly time frame has not been updated. Nevertheless, the pair returned to the level of 1.0748, and failed to settle below the critical line. And the rising trend line remains relevant at this time. Thus, for the time being, all technical factors continue to support the euro on lower timeframes. But consolidating below the Kijun-sen and the trend line may break the upward trend and then the euro may well again rush to its 20-year lows. Yesterday the euro was supported by the report on US GDP in the first quarter. The second estimate of this indicator turned out to be even worse than the first, which caused the dollar to fall. However, it should be noted that the market's reaction to this report was not too strong. Take note that settling below the trend line without overcoming the critical line can keep the upward trend, as is currently happening with the pound.
In regards to trading signals on Thursday, everything was extremely simple. There were none. During the day, the pair did not approach either the level of 1.0637 or the level of 1.0748 – the nearest price targets. Thus, transactions were not opened, respectively, neither profit nor loss was received. Volatility was average.
COT report:
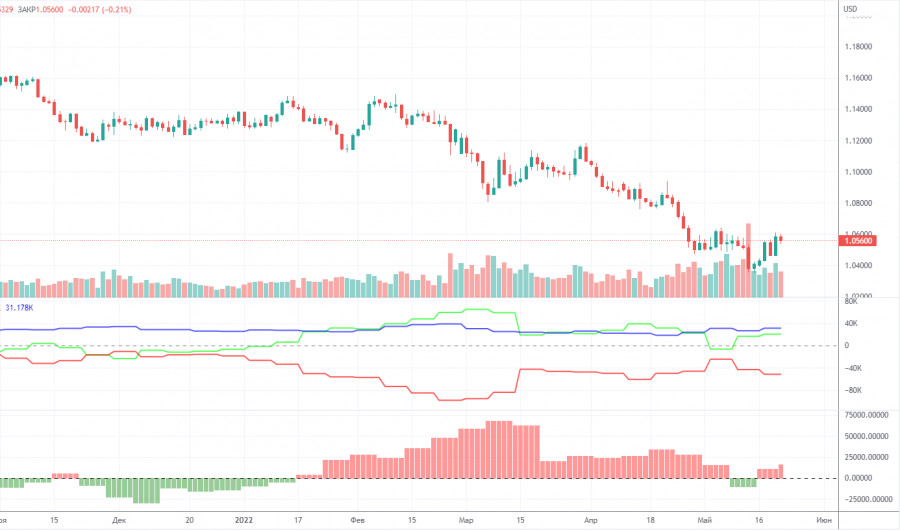
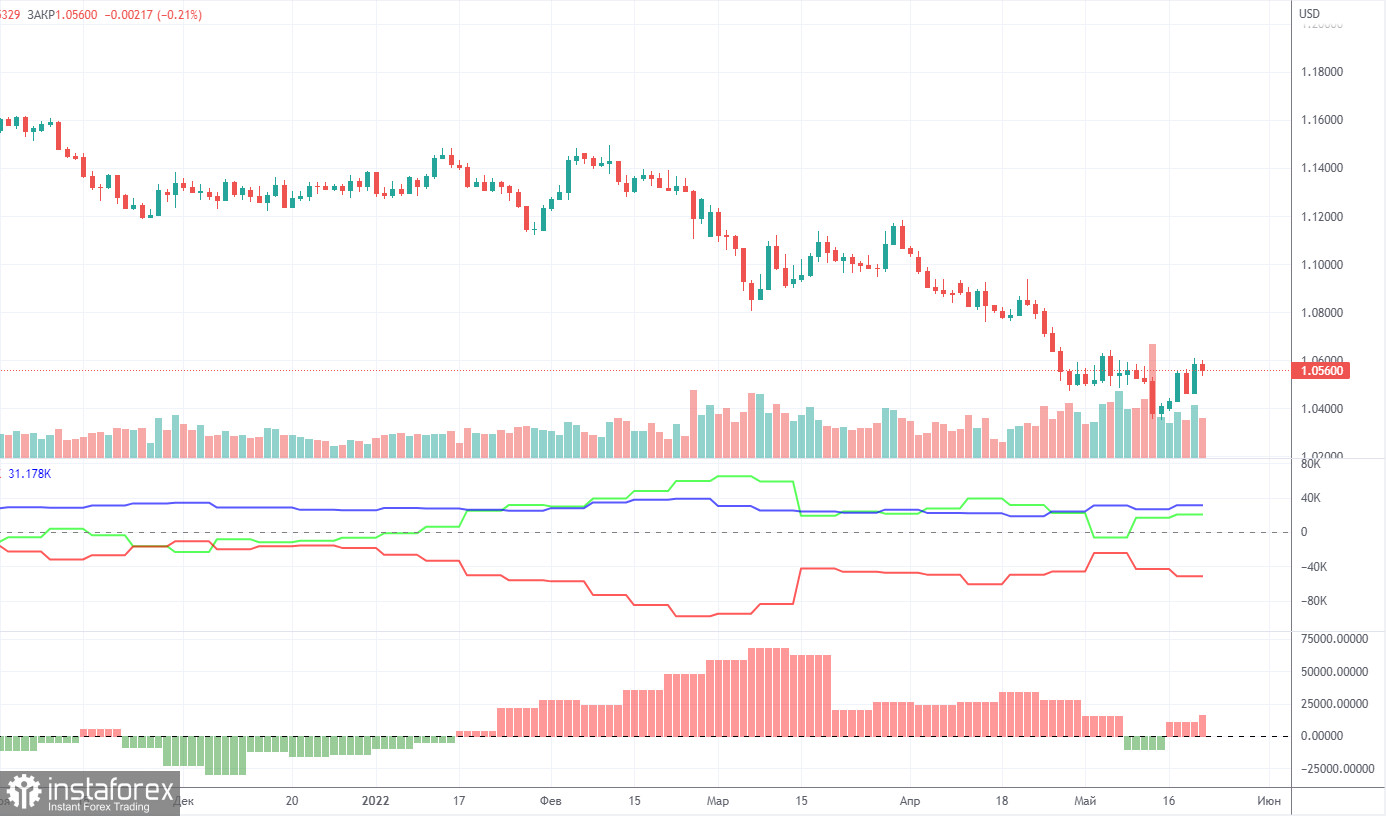
The latest Commitment of Traders (COT) reports on the euro caused and continue to raise more and more questions. The COT report showed the bearish mood of major players only once in the past few months, but in the last two weeks, the bullish mood is intensifying again. That is, a paradoxical situation remains, in which the euro currency has been falling for a long time, but professional players are buying up the euro, and not selling it. During the reporting week, the number of long positions increased by 2,500, while the number of shorts in the non-commercial group decreased by 1,200. Thus, the net position grew by 3,700 contracts per week. The number of longs exceeds the number of shorts for non-commercial traders by 20,000. From our point of view, this happens because the demand for the US dollar is much higher than the demand for the euro. Even if someone suggested that the whole point is the weakening of the bullish mood in recent months (the second indicator is the histogram), then this is hardly the case. The euro simply refuses to grow, despite any actions of major players. The chart above clearly shows that the euro fell both when the net position grew (increasing bullish sentiment) and when the net position decreased (weakened bullish sentiment). Thus, it is still impossible to draw a correlation between COT reports and what is happening in the market. It makes no sense to build forecasts on such data, all the more.
We recommend that you familiarize yourself with:
Overview of the EUR/USD pair. May 27. The information field is already oversaturated with data from the Fed and the ECB.
Overview of the GBP/USD pair. May 27. All the danger of a trade war between the EU and the UK is already understood even in Ireland, which is "at the forefront" of the conflict.
Forecast and trading signals for GBP/USD on May 27. Detailed analysis of the movement of the pair and trading transactions.
EUR/USD 1H
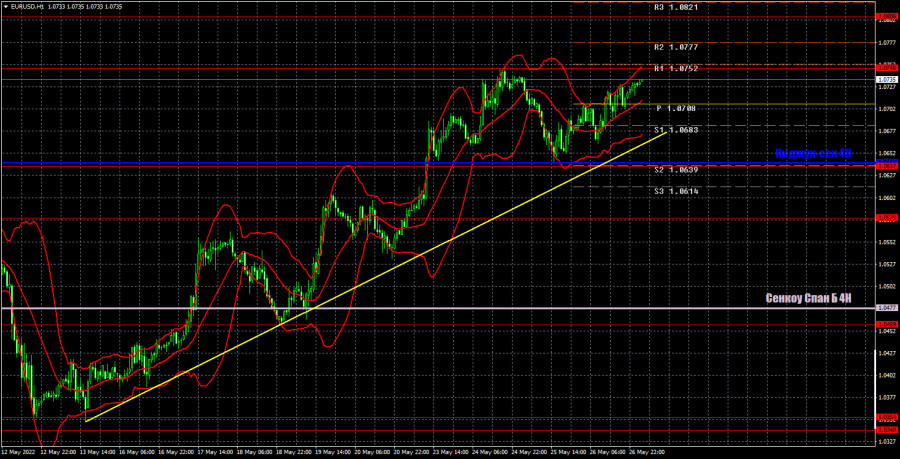
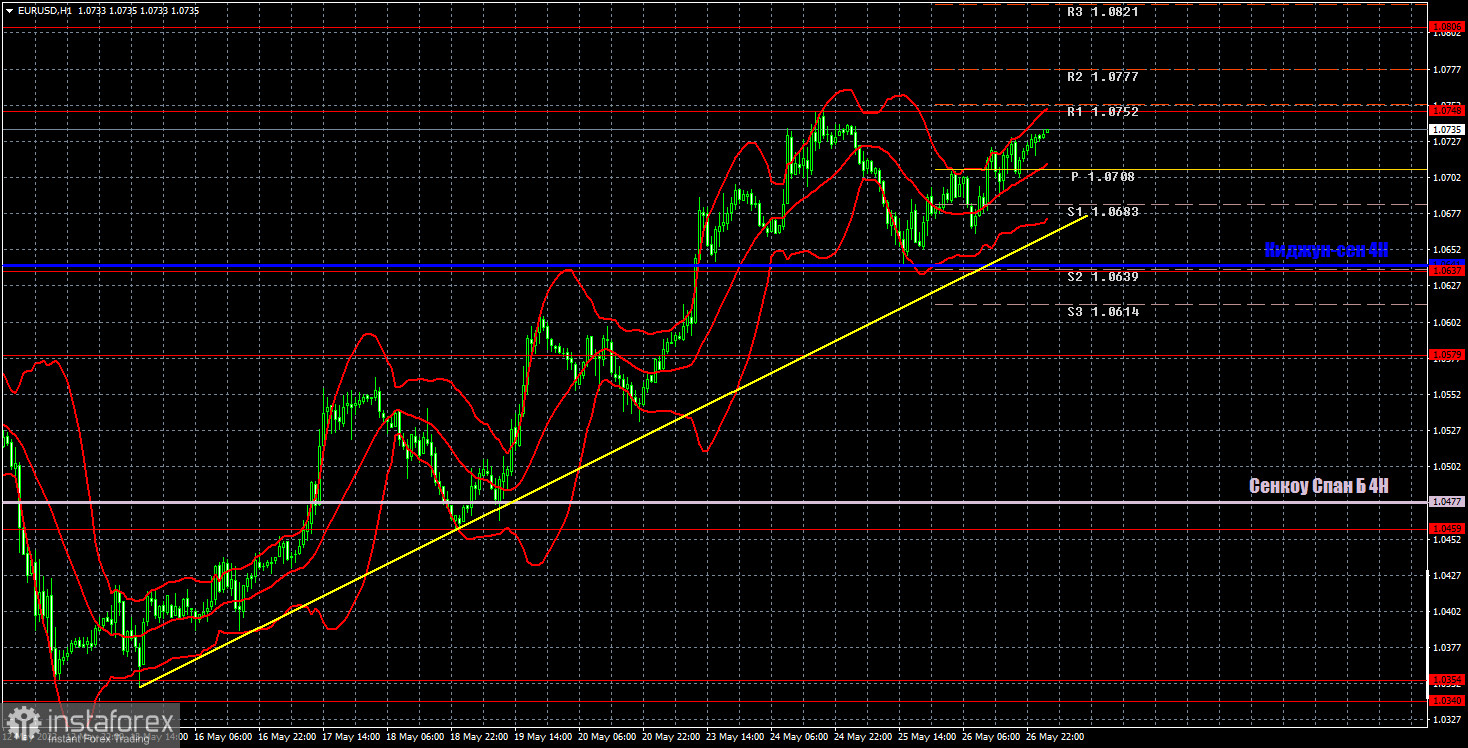
It is clearly seen on the hourly timeframe that the ascending trend line remains relevant. Despite the fact that the euro's growth is now purely technical, there is a trend, which means that you should continue trading on it. If the pair settles below the trend line, then the downward trend may resume, because the price has not yet moved far enough from its 20-year lows to consider the trend completely completed. Today we highlight the following levels for trading - 1.0459, 1.0579, 1.0637, 1.0748, 1.0806, as well as Senkou Span B (1.0477) and Kijun-sen (1.0641). Ichimoku indicator lines can move during the day, which should be taken into account when determining trading signals. There are also secondary support and resistance levels, but no signals are formed near them. Signals can be "rebounds" and "breakthrough" extreme levels and lines. Do not forget about placing a Stop Loss order at breakeven if the price has gone in the right direction for 15 points. This will protect you against possible losses if the signal turns out to be false. Nothing interesting planned for today in the European Union. Meanwhile, we only have reports on personal income and expenses of the American population in the US. This report is not that important. The market reaction may, of course, follow it, but most likely it will be very weak - 20 points.
Explanations for the chart:
Support and Resistance Levels are the levels that serve as targets when buying or selling the pair. You can place Take Profit near these levels.
Kijun-sen and Senkou Span B lines are lines of the Ichimoku indicator transferred to the hourly timeframe from the 4-hour one.
Support and resistance areas are areas from which the price has repeatedly rebounded off.
Yellow lines are trend lines, trend channels and any other technical patterns.
Indicator 1 on the COT charts is the size of the net position of each category of traders.
Indicator 2 on the COT charts is the size of the net position for the non-commercial group.