Analysis of Tuesday's trades:
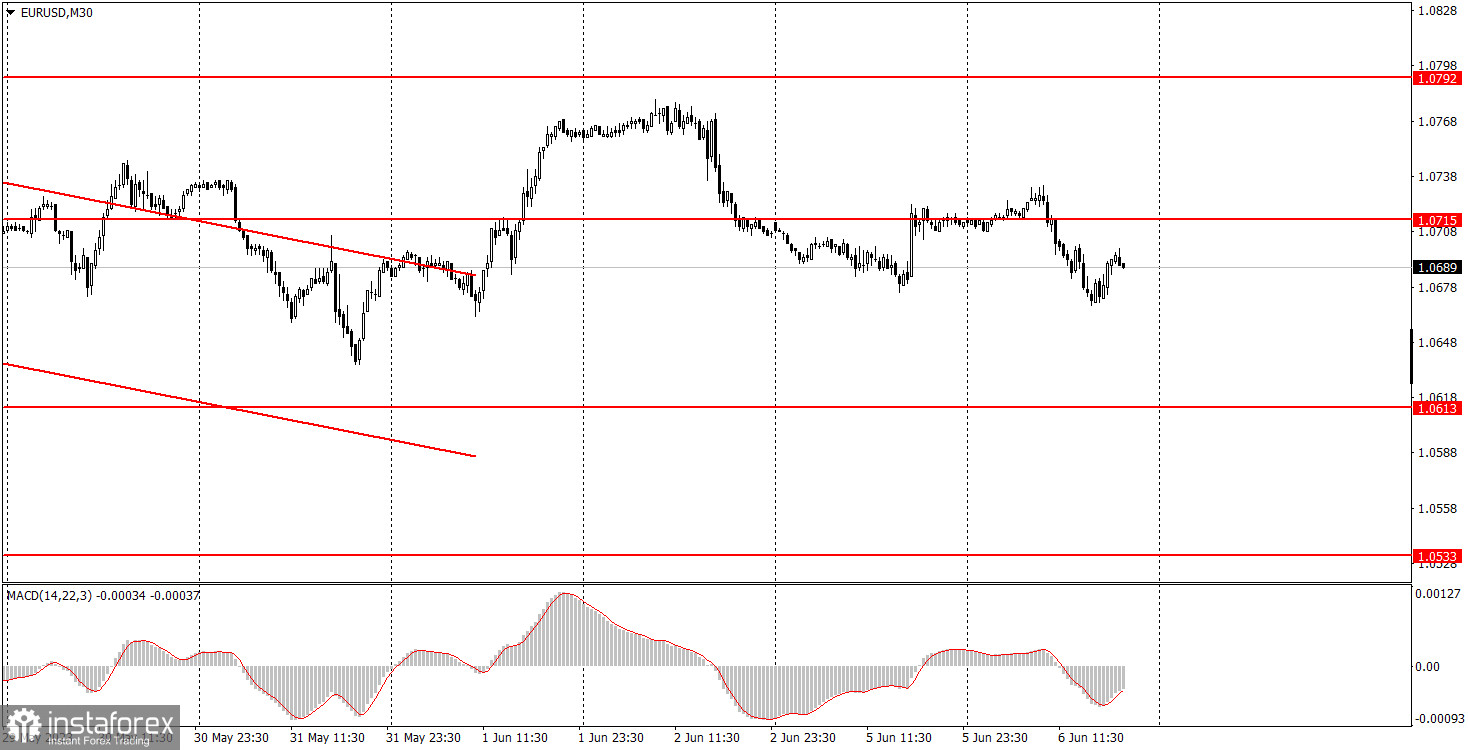
EUR/USD 30M chart
On Tuesday, volatility in EUR/USD was low, and it was largely moving sideways rather than exhibiting any significant upward or downward trajectory. Admittedly, the pair did shed a few dozen points throughout the day, but with a total movement of only 65 pips, it's hardly indicative of any serious trend shifts. A look at a higher timeframe or a retrospective view of the 30-minute chart shows that the pair has been entrenched in a sideways trend for the past nine trading days. This isn't a well-defined sideways channel that provides trading opportunities, but a sideways drift. At present, the only discernible trend is this sideways one. Despite having moved above the descending channel a few days ago, the pair isn't displaying any signs of an upward trend. The fundamental and macroeconomic backdrop was notably weak on both Monday and Tuesday, and is expected to remain so throughout the current week. The conclusion is apparent: the current trading conditions are not particularly favorable.
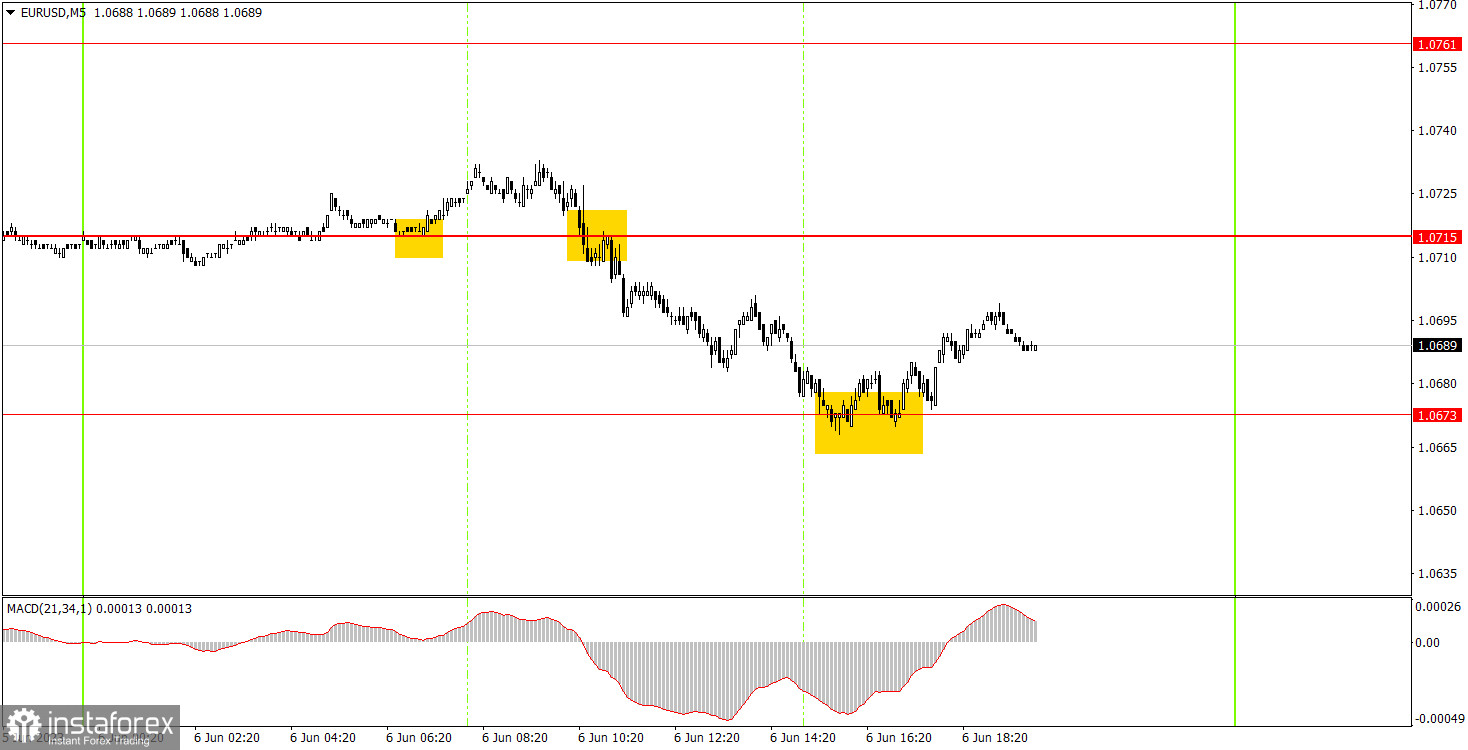
EUR/USD 5M chart
Several trading signals, ideal for novice traders, materialized on the 5-minute timeframe on Tuesday. Initially, the pair rebounded off the 1.0715 level, but it only managed to ascend a meager 9 pips, which was insufficient even for setting a breakeven stop loss. Subsequently, a sell signal was triggered when the price held below the 1.0715 level. Here, the pair was able to exhibit a significant move in the correct direction, successfully hitting the nearest target level at 1.0673. Then the price rebounded from that level, suggesting that the sell position should be closed with a profit of about 25 pips, and immediately replaced by a long position. Long trades could have garnered an additional profit of 10-15 pips. No further signals were formed until the evening, which indicates that the last trade should have been closed manually.
Trading strategy for Wednesday:
On the 30-minute timeframe, the pair indicates a slight inclination to terminate its descending trend. The price has broken out of the downward channel, suggesting that the euro could attempt to rise for a while. As of now, we observe no upward movements. In the medium term, we anticipate a resumption of the downward trend. On the 5-minute timeframe, levels to be considered tomorrow are 1.0517-1.0533, 1.0607-1.0613, 1.0673, 1.0715, 1.0761, 1.0792, and 1.0857-1.0867. Once a move of 15 pips in the desired direction is confirmed, a breakeven stop loss can be placed. On Wednesday, a speech by the Vice-President of the ECB, Luis de Guindos, is scheduled in the eurozone. In the US, there are no significant events lined up. Most likely, we should brace ourselves for another low-volatility day, predominantly marked by sideways movement.
The basic principles of the trading system:
1) The strength of the signal depends on the time period during which the signal was formed (a rebound or a break). The shorter this period, the stronger the signal.
2) If two or more trades were opened at some level following false signals, i.e. those signals that did not lead the price to Take Profit level or the nearest target levels, then any consequent signals near this level should be ignored.
3) During the flat trend, any currency pair may form a lot of false signals or do not produce any signals at all. In any case, the flat trend is not the best condition for trading.
4) Trades are opened in the time period between the beginning of the European session and until the middle of the American one when all deals should be closed manually.
5) We can pay attention to the MACD signals in the 30M time frame only if there is good volatility and a definite trend confirmed by a trend line or a trend channel.
6) If two key levels are too close to each other (about 5-15 pips), then this is a support or resistance area.
How to read charts:
Support and Resistance price levels can serve as targets when buying or selling. You can place Take Profit levels near them.
Red lines are channels or trend lines that display the current trend and show which direction is better to trade.
MACD indicator (14,22,3) is a histogram and a signal line showing when it is better to enter the market when they cross. This indicator is better to be used in combination with trend channels or trend lines.
Important speeches and reports that are always reflected in the economic calendars can greatly influence the movement of a currency pair. Therefore, during such events, it is recommended to trade as carefully as possible or exit the market in order to avoid a sharp price reversal against the previous movement.
Beginning traders should remember that every trade cannot be profitable. The development of a reliable strategy and money management are the key to success in trading over a long period of time.